%2FWW6nBVonWSmvcrrUACWdG9.png&w=1200&q=100)
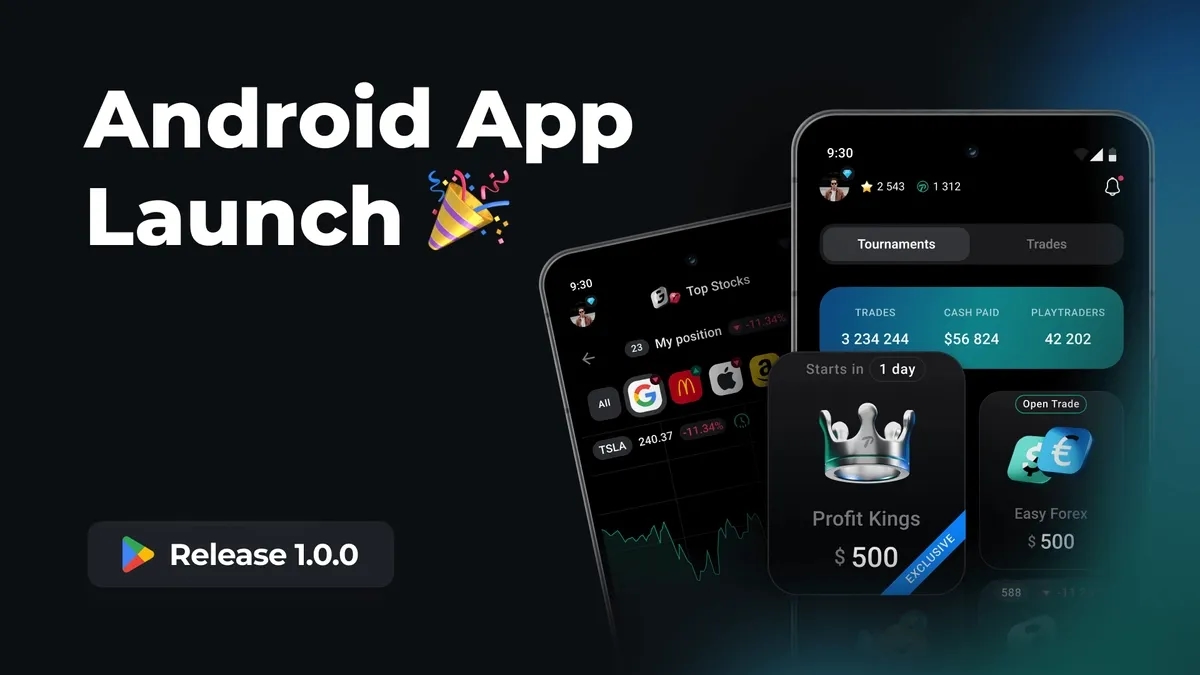
Profit.com Android App Update
mei 13

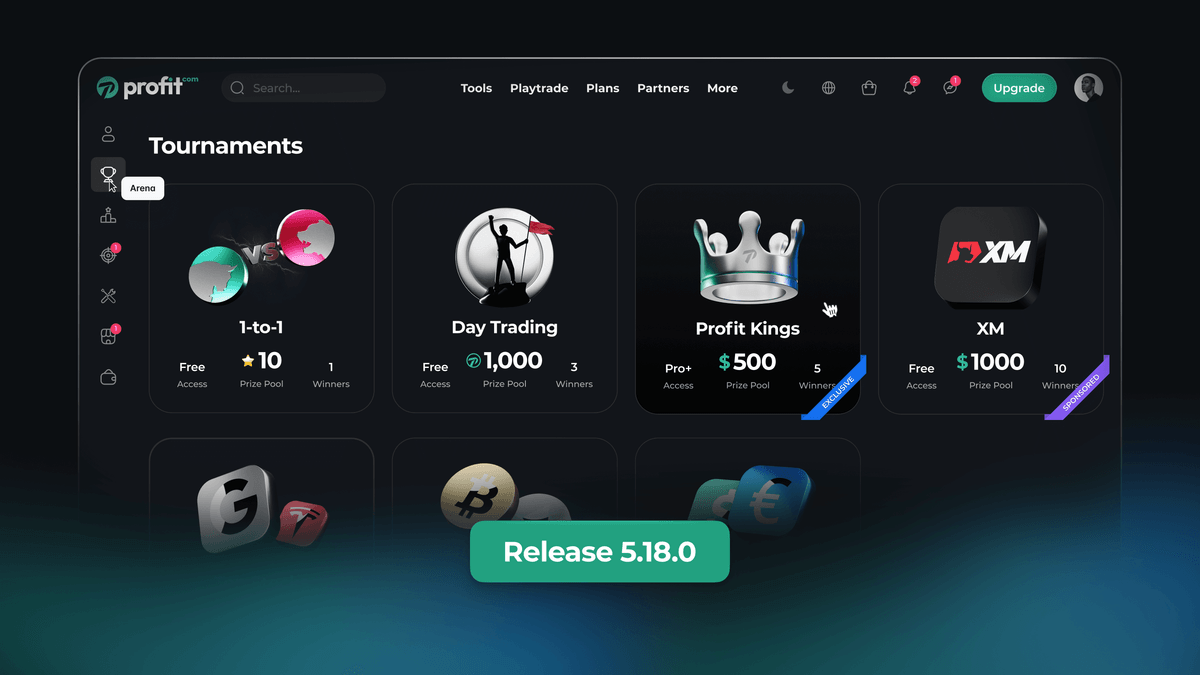
We zijn verheugd om de lancering van onze nieuwe Chart Widget aan te kondigen, ontworpen om verbeterde data visualisatiemogelijkheden voor websites te bieden.
De Chart Widget stelt website-eigenaren in staat om visueel verbluffende en interactieve grafieken weer te geven, waardoor bezoekers gegevens gemakkelijk kunnen interpreteren en analyseren. Met een gebruiksvriendelijke interface en aanpasbare opties biedt de Chart Widget een naadloze en boeiende data visualisatie-ervaring.
Belangrijkste kenmerken van de Chart Widget zijn:
Geef data weer op een visueel aantrekkelijke en intuïtieve manier, waardoor gebruikers trends en inzichten moeiteloos kunnen begrijpen.
Gebruikers kunnen met de grafieken communiceren, inzoomen, datapunten selecteren en toegang krijgen tot gedetailleerde informatie voor een diepere analyse.
Pas het uiterlijk, de kleuren en de grafiektypen aan om deze af te stemmen op de branding en het ontwerp van uw website.
Om meer te weten te komen over de Chart Widget en deze te integreren in uw website, bezoek onze Widgets-pagina.
Nee
Een beetje
Goed


%2FjJpoRm4983kvbshfFZzcwi.png&w=1200&q=100)